Crafter.ai platform integrates an Analytics dashboard from which it is possible to access the chatbot insights and monitor the KPIs of the virtual assistant, consult automatically generated data and graphs and download detailed reports (in .csv and .pdf format) to be integrated with your own business intelligence software (e.g. Power BI, Tableau etc.).
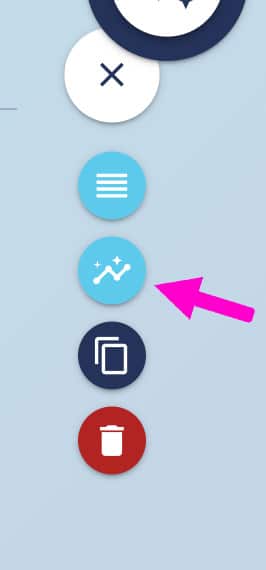
Click on the three dots on the bot’s home screen.

Click on the Analytics icon from the menu, as shown in the figure:
Select the Analytics tab:
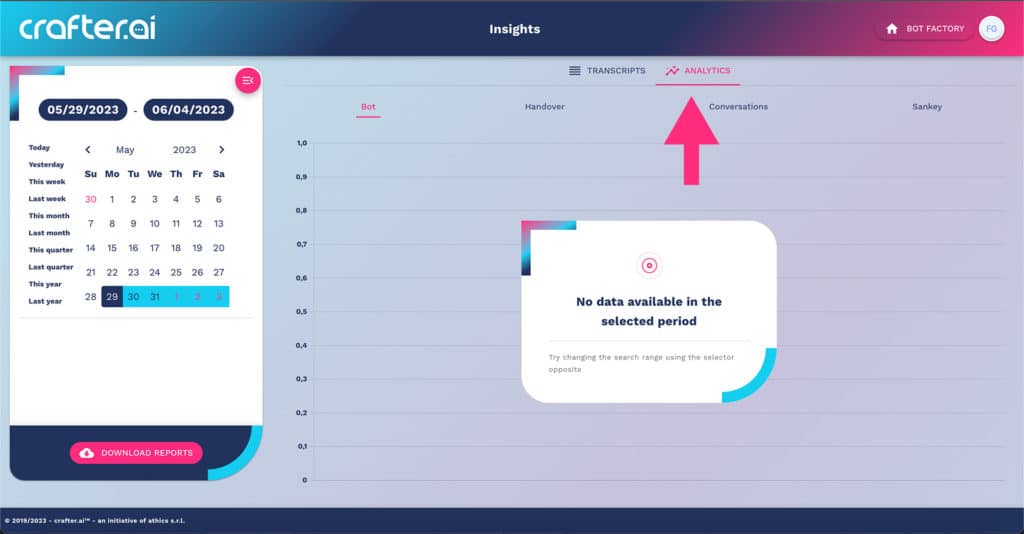
If your bot has just been created, no analytics data will be available.
Generate enough conversations to see the first data.
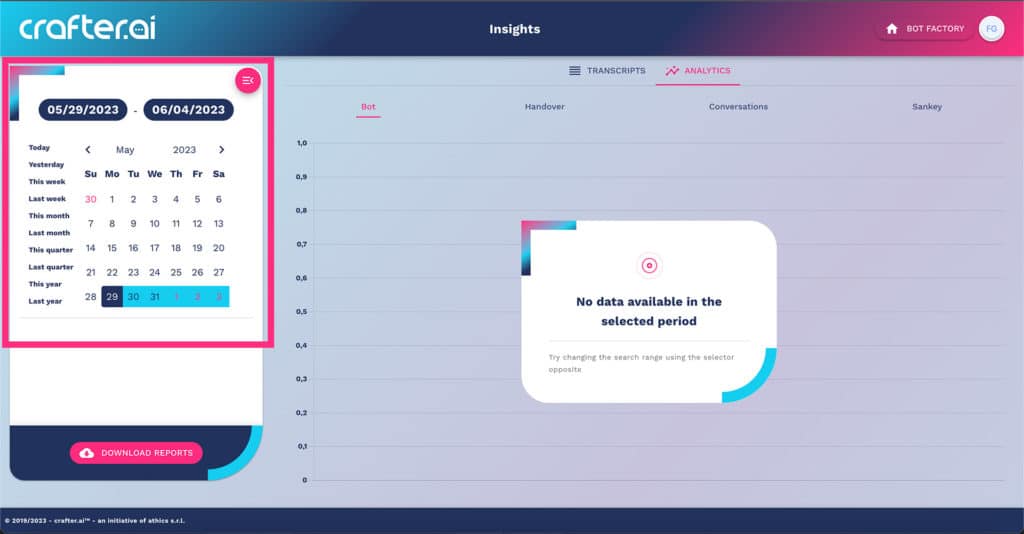
Use the calendar on the left to filter the data based on a reference time period:
Within the analytics wizard you will see several tabs: bot, handover, conversations, Sankey:
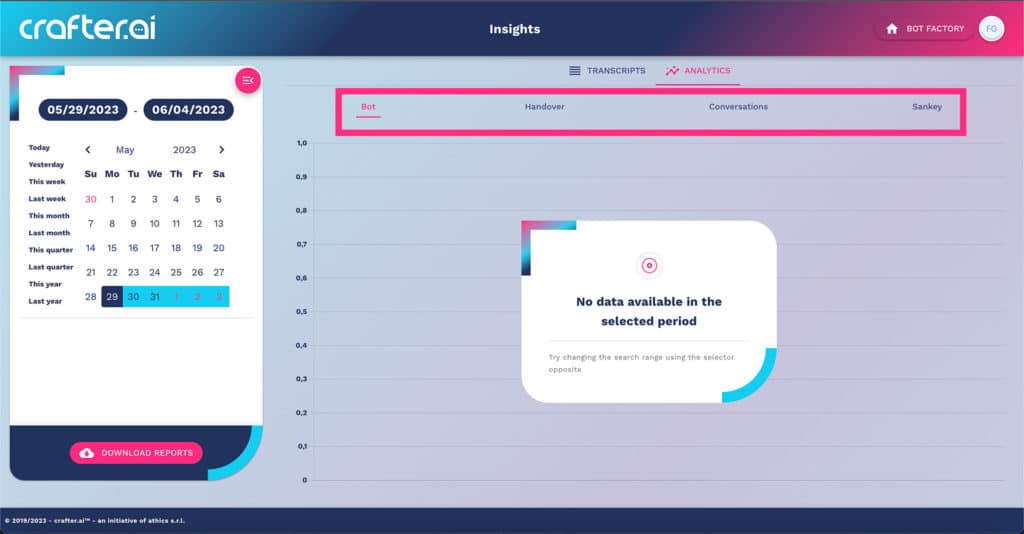
The Bot tab shows the summary data of the bot’s activities: total conversations handled, number of “misses” (messages not handled), number of handovers generated (transfers of conversations to the operator).
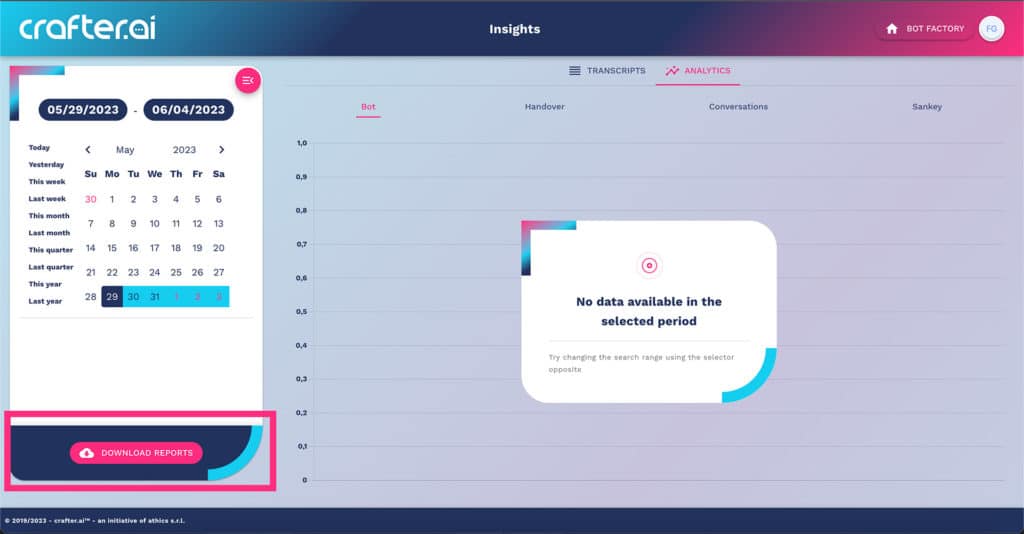
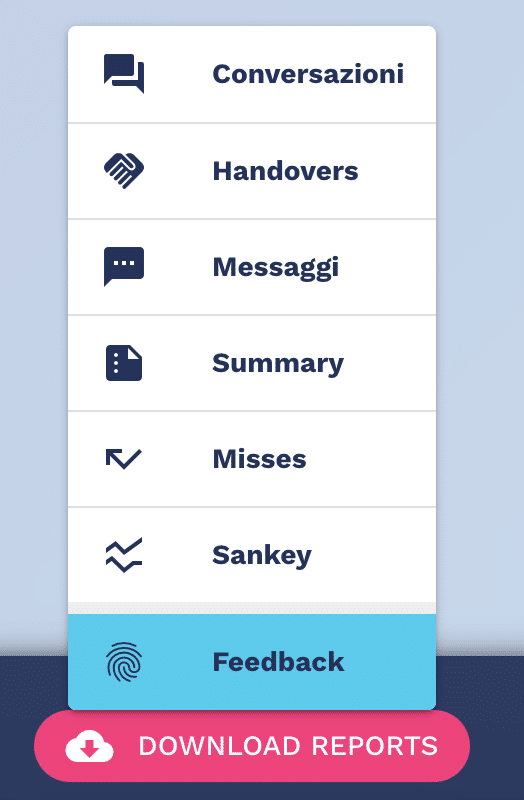
The Download Reports button at the bottom left allows you to download detailed reports for each of the available areas (Conversations, Handovers, Messages, Summary, Misses, Sankey, Feedback.
To download a report click on the button and choose the report from the menu.
A .csv file will be downloaded.