The handover dashboard is the platform area where agents and supervisors can access and monitor the data resulting from handover management activities.

The “Activity” column shows the number of processed and pending handovers, and a summary of the total number of handovers and leads generated.
The green indicator refers to the number of handovers that have been handled.
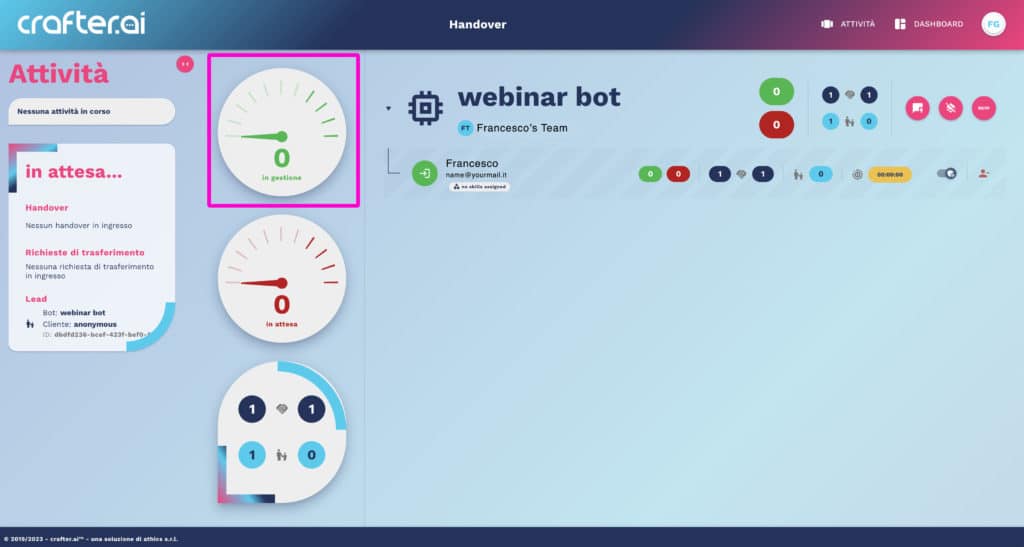
The red indicator shows the number of handover requests that are waiting to be handled.
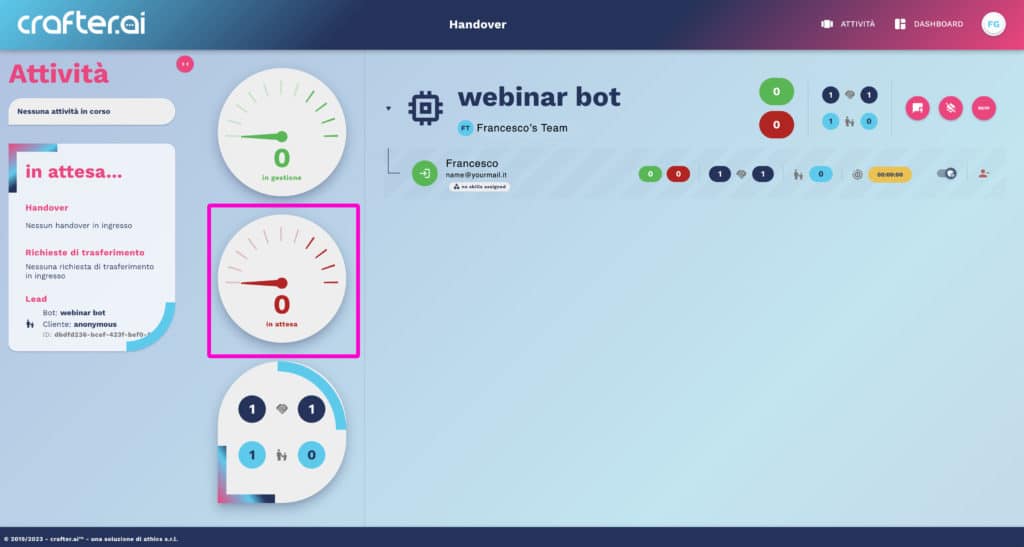
A recap indicator shows the overall data: total number of handovers requested, total number of processed handovers, total number of leads to be managed, total number of leads that have been managed.
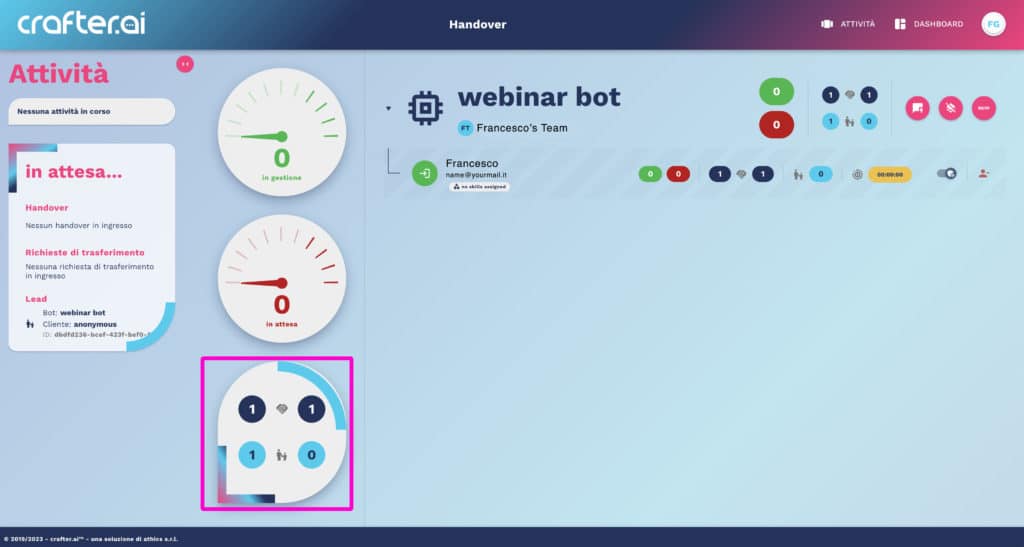
The dashboard on the right shows the overall data of the handover management activities.
Click on the arrow to view detailed activities for each agent.
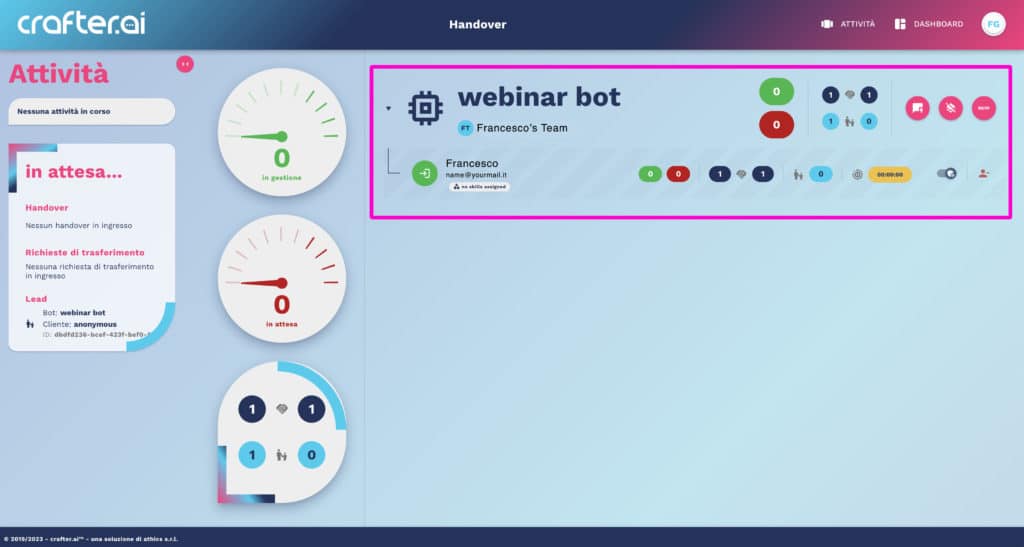
The green and red buttons indicate processed and pending handovers.
The dark blue buttons indicate the total number of handovers handled.
The light blue buttons indicate the total number of leads handled.
The yellow button indicates the time spent by each agent in back office activities.
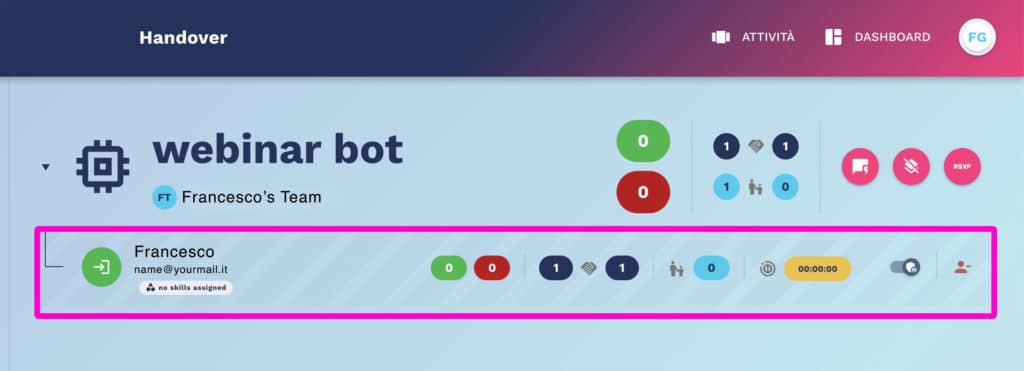
The selector on the right allows you to change the role of each agent. This button will be active for supervisors only.
The last button on the right allows you to remove the agent from the bot (active for supervisors only).
