Once a sufficient number of conversations have been generated, you will be able to graphically view the generated analytics.
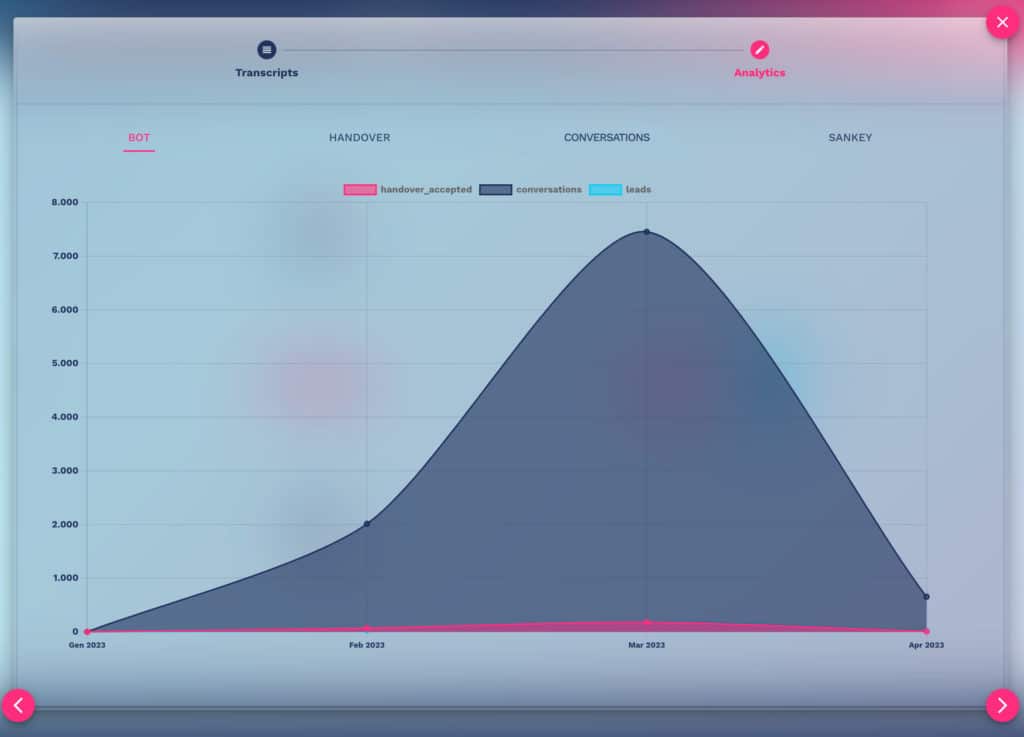
The Bot tab will show summary data of handovers accepted, conversations, and generated leads
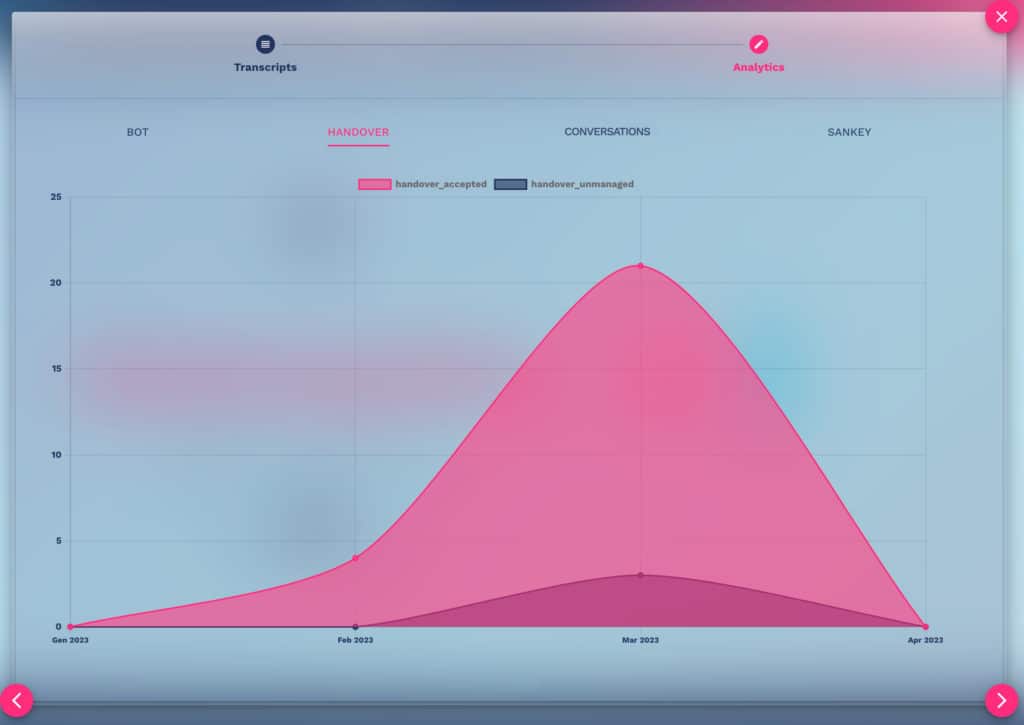
The handover tab will show the total number of managed and un-managed handovers:
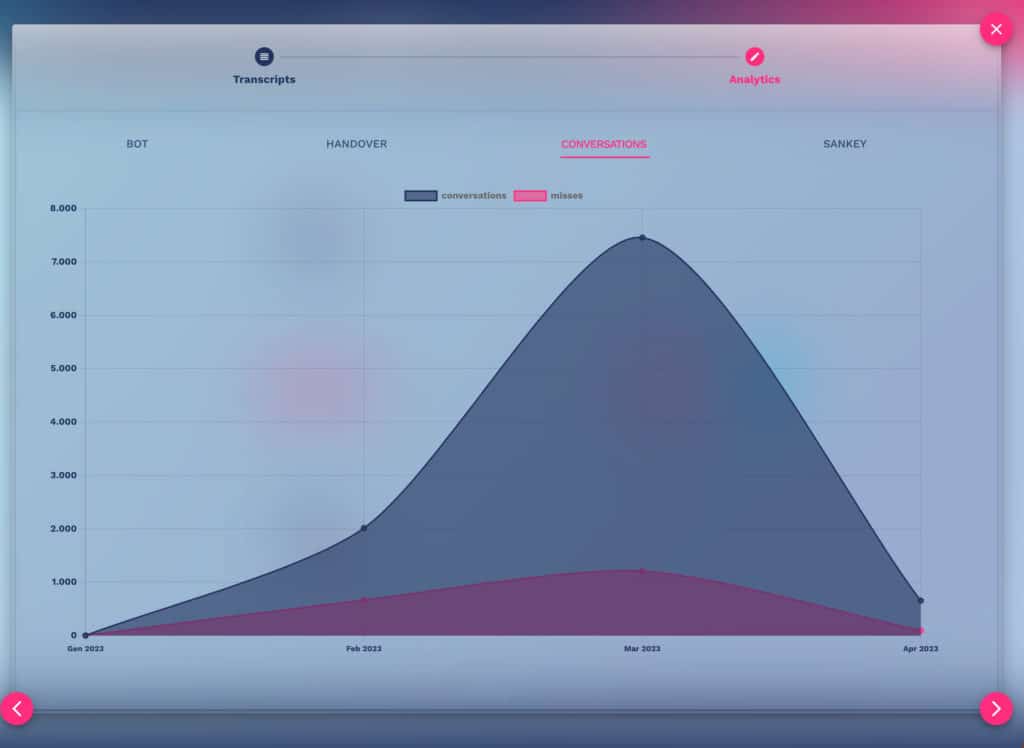
The conversations tab shows the total number of conversations and the details of un-managed messages (misses)
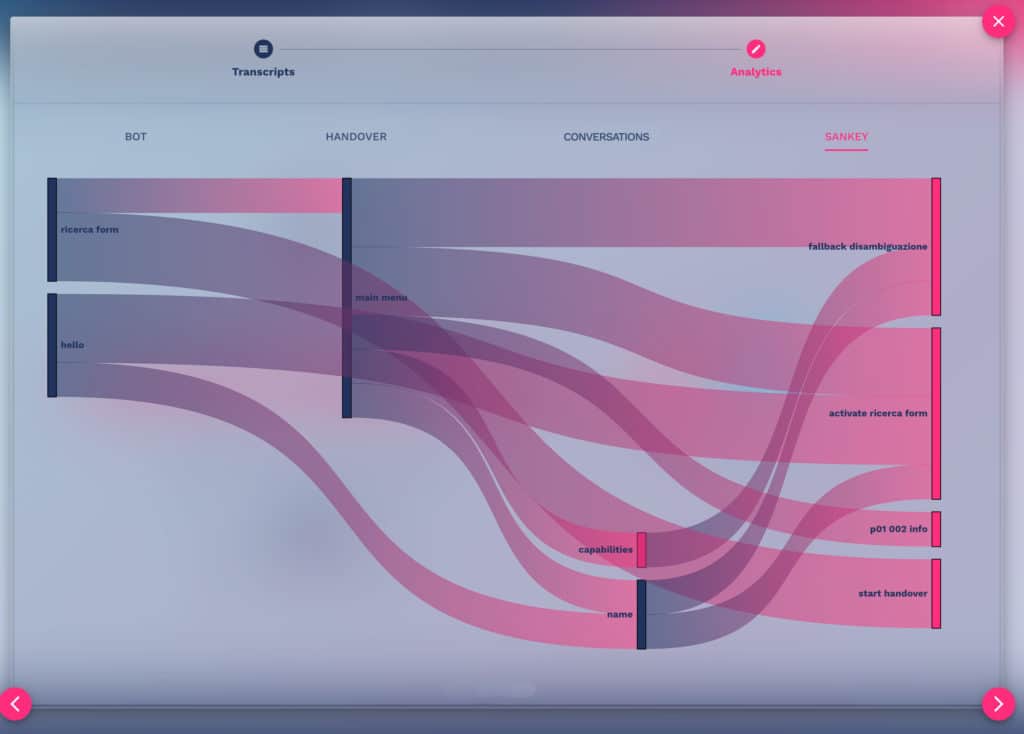
The Sankey diagram allows you to graphically view the areas where conversation flows are concentrated: